

Project managers and quality assurance teams
Brainstorming root causes of a recurring issue in a team retrospective
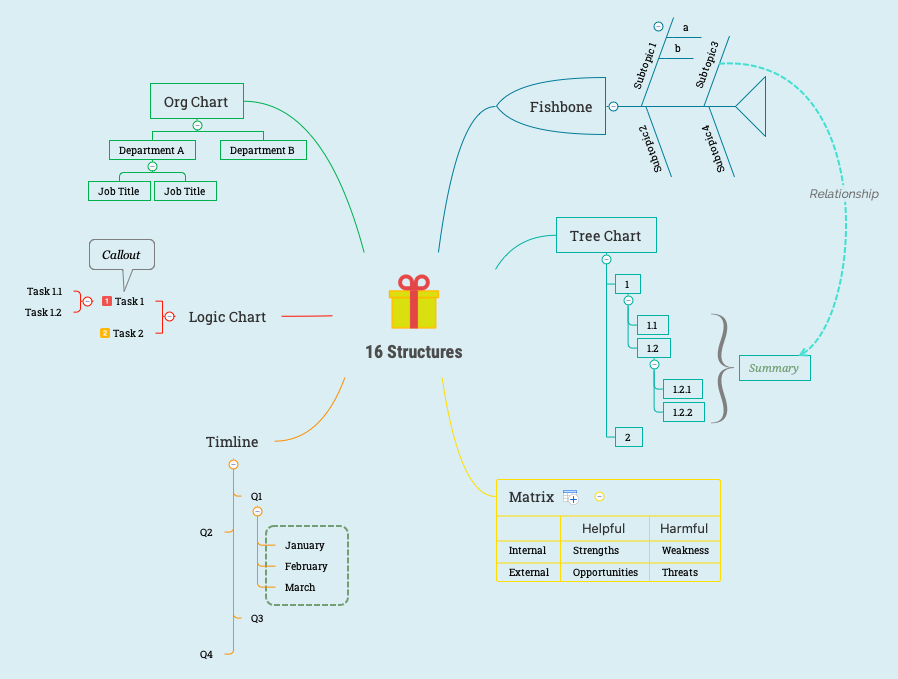
The 16 Structures mind map template from Xmind showcases six distinct diagram structures—Fishbone, Tree Chart, Matrix, Timeline, Logic Chart, and Org Chart—each with sample content to illustrate its layout and use. With 42 nodes across a single sheet, this template serves as a visual cheat sheet for choosing the right structure for brainstorming, project planning, or data organization. The Fishbone branch includes 'Subtopic 1' with sub-items 'a' and 'b', while the Matrix branch organizes 'Strengths' and 'Weaknesses' under 'Internal' and 'Opportunities' and 'Threats' under 'External'. This template is ideal for anyone exploring Xmind's structural capabilities or needing a quick reference for common diagram formats.
Điều khoản sử dụngBrainstorming root causes of a recurring issue in a team retrospective
Planning a quarterly marketing campaign with milestones and deadlines
Designing a company org chart for onboarding new employees
Open the .xmind file to review the six distinct diagram layouts like Fishbone and Matrix to find the best fit for your data.
Replace the sample text with your own information and use the Tab or Enter keys to add new subtopics and branches.
Use the Style panel to personalize colors, icons, and connectors to match your specific project planning or branding needs.
It's a reference template that demonstrates six different Xmind structures—Fishbone, Tree Chart, Matrix, Timeline, Logic Chart, and Org Chart—with sample data, helping users choose the right layout for their projects.
Open the .xmind file, click on the Matrix branch, and replace the sample nodes like 'Strengths' and 'Weaknesses' with your own internal and external factors for a personalized SWOT analysis.
Yes, the Timeline structure with 'Q1' through 'Q4' and monthly breakdowns is ideal for planning project phases, while the Logic Chart helps sequence tasks like 'Task 1' and 'Task 1.1'.
The template is available on Xmind's marketplace and is fully editable in Xmind desktop or web app. You can modify any node, add branches, or change colors to fit your needs.
The Org Chart shows a hierarchical organization with 'Department A' containing 'Job Title' nodes, useful for mapping team structures or reporting lines.
Chia sẻ mẫu sơ đồ tư duy của bạn với người sáng tạo trên khắp thế giới và bắt đầu kiếm tiền từ tác phẩm của mình.

