




Project managers and operations leads
During a quarterly cost review meeting to identify why project margins are shrinking.
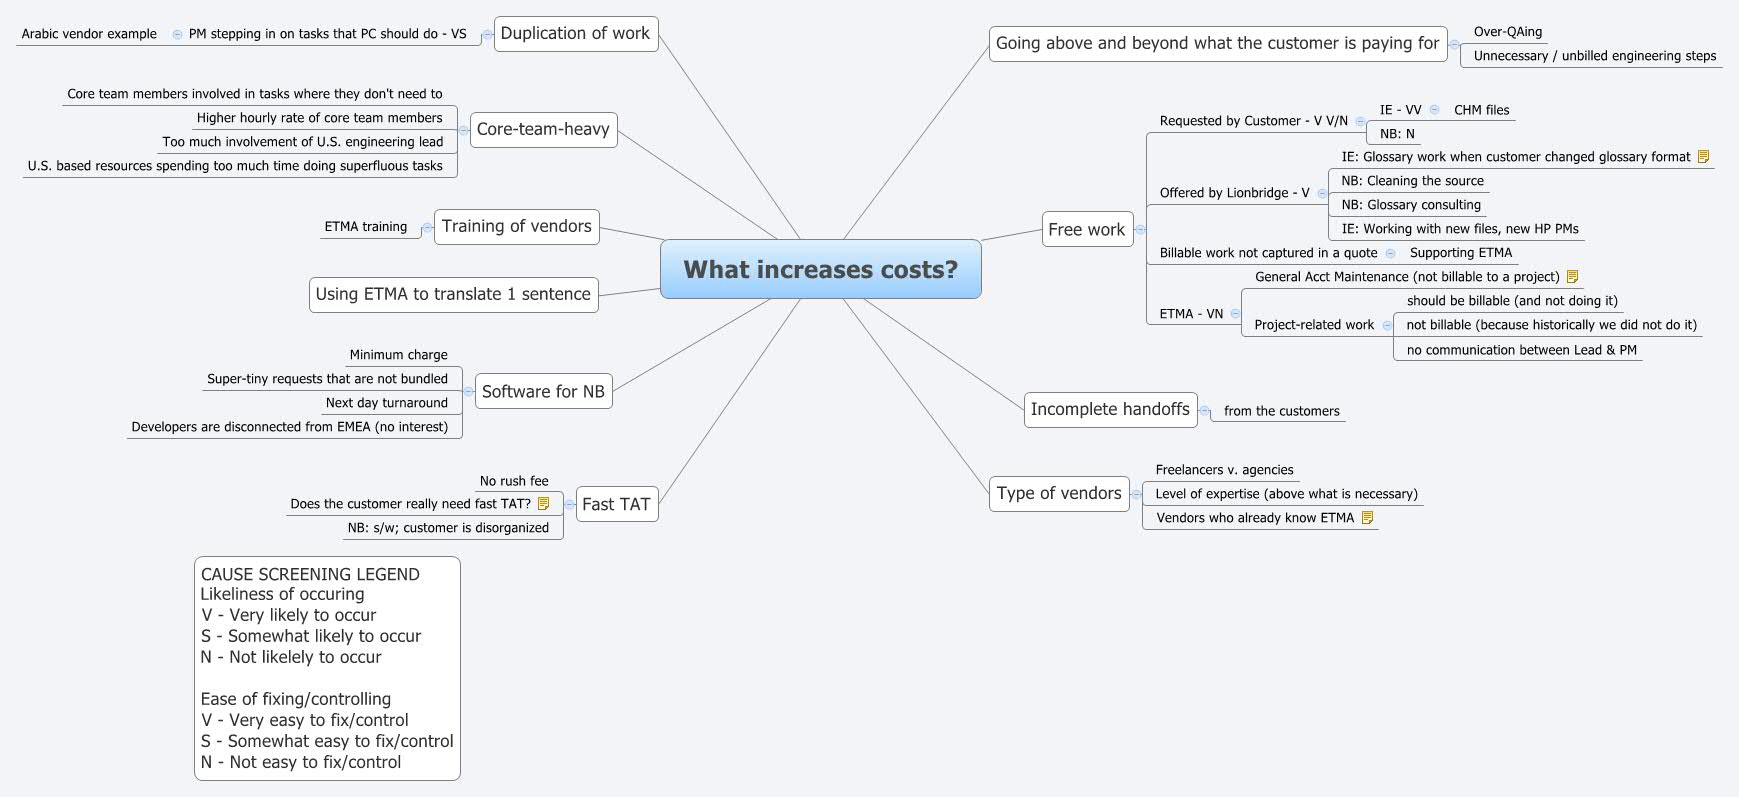
This cost analysis mind map, titled 'What increases costs?', identifies 10 primary drivers of cost overruns in a localization or language services operation, with 49 nodes covering root causes, risk assessment, and mitigation cues. The template includes a 'CAUSE SCREENING LEGEND' that rates each cause on Likeliness of Occurring (V/S/N) and Ease of Fixing/Controlling (V/S), enabling teams to prioritize actions. Key branches such as 'Going above and beyond what the customer is paying for' and 'Free work' highlight common unbilled activities like 'Over-QAing' and 'Billable work not captured in a quote'. The mind map is structured as a radial diagram with color-coded branches for quick visual scanning. This 'What increases costs?' mind map template serves as a practical cheat sheet for project managers and operations leads to diagnose and control cost escalations.
Terms and ConditionsDuring a quarterly cost review meeting to identify why project margins are shrinking.
When onboarding a new client with complex requirements that may lead to scope creep.
After a project overrun to conduct a root-cause analysis and prevent recurrence.
Open the .xmind file in Xmind desktop or web application.
Review the main branches (e.g., 'Free work', 'Duplication of work') and expand sub-nodes to see specific causes.
For each cause, update the 'Likeliness of occurring' and 'Ease of fixing' ratings based on your project context.
Add new cost drivers by inserting child nodes under the root or relevant branch.
Use the legend to prioritize and create an action plan to address high-likelihood, easy-to-fix items first.
The template includes 10 major cost drivers such as 'Free work', 'Incomplete handoffs', 'Duplication of work', and 'Fast TAT', each with sub-nodes and a cause screening legend for risk assessment.
Review each branch to identify which cost drivers apply to your project. Use the 'Likeliness of occurring' and 'Ease of fixing' ratings to prioritize actions, such as eliminating unbilled work or improving handoff processes.
Yes, the template is fully editable in Xmind. You can add or remove nodes, adjust ratings, and customize the legend to fit your specific operational context.
The legend rates each cause on two axes: Likeliness of Occurring (V=Very likely, S=Somewhat, N=Not likely) and Ease of Fixing/Controlling (V=Very easy, S=Somewhat easy). This helps prioritize which issues to address first.
Absolutely. While the examples reference localization (e.g., 'ETMA', 'NB'), the structure is generic enough to apply to any service or project where cost drivers need to be identified and assessed.
Share your mind map templates with creators around the world and start earning from your work.

