

Recruiting managers and HR analysts
Monthly recruiting performance review to analyze sourcer and campaign effectiveness.
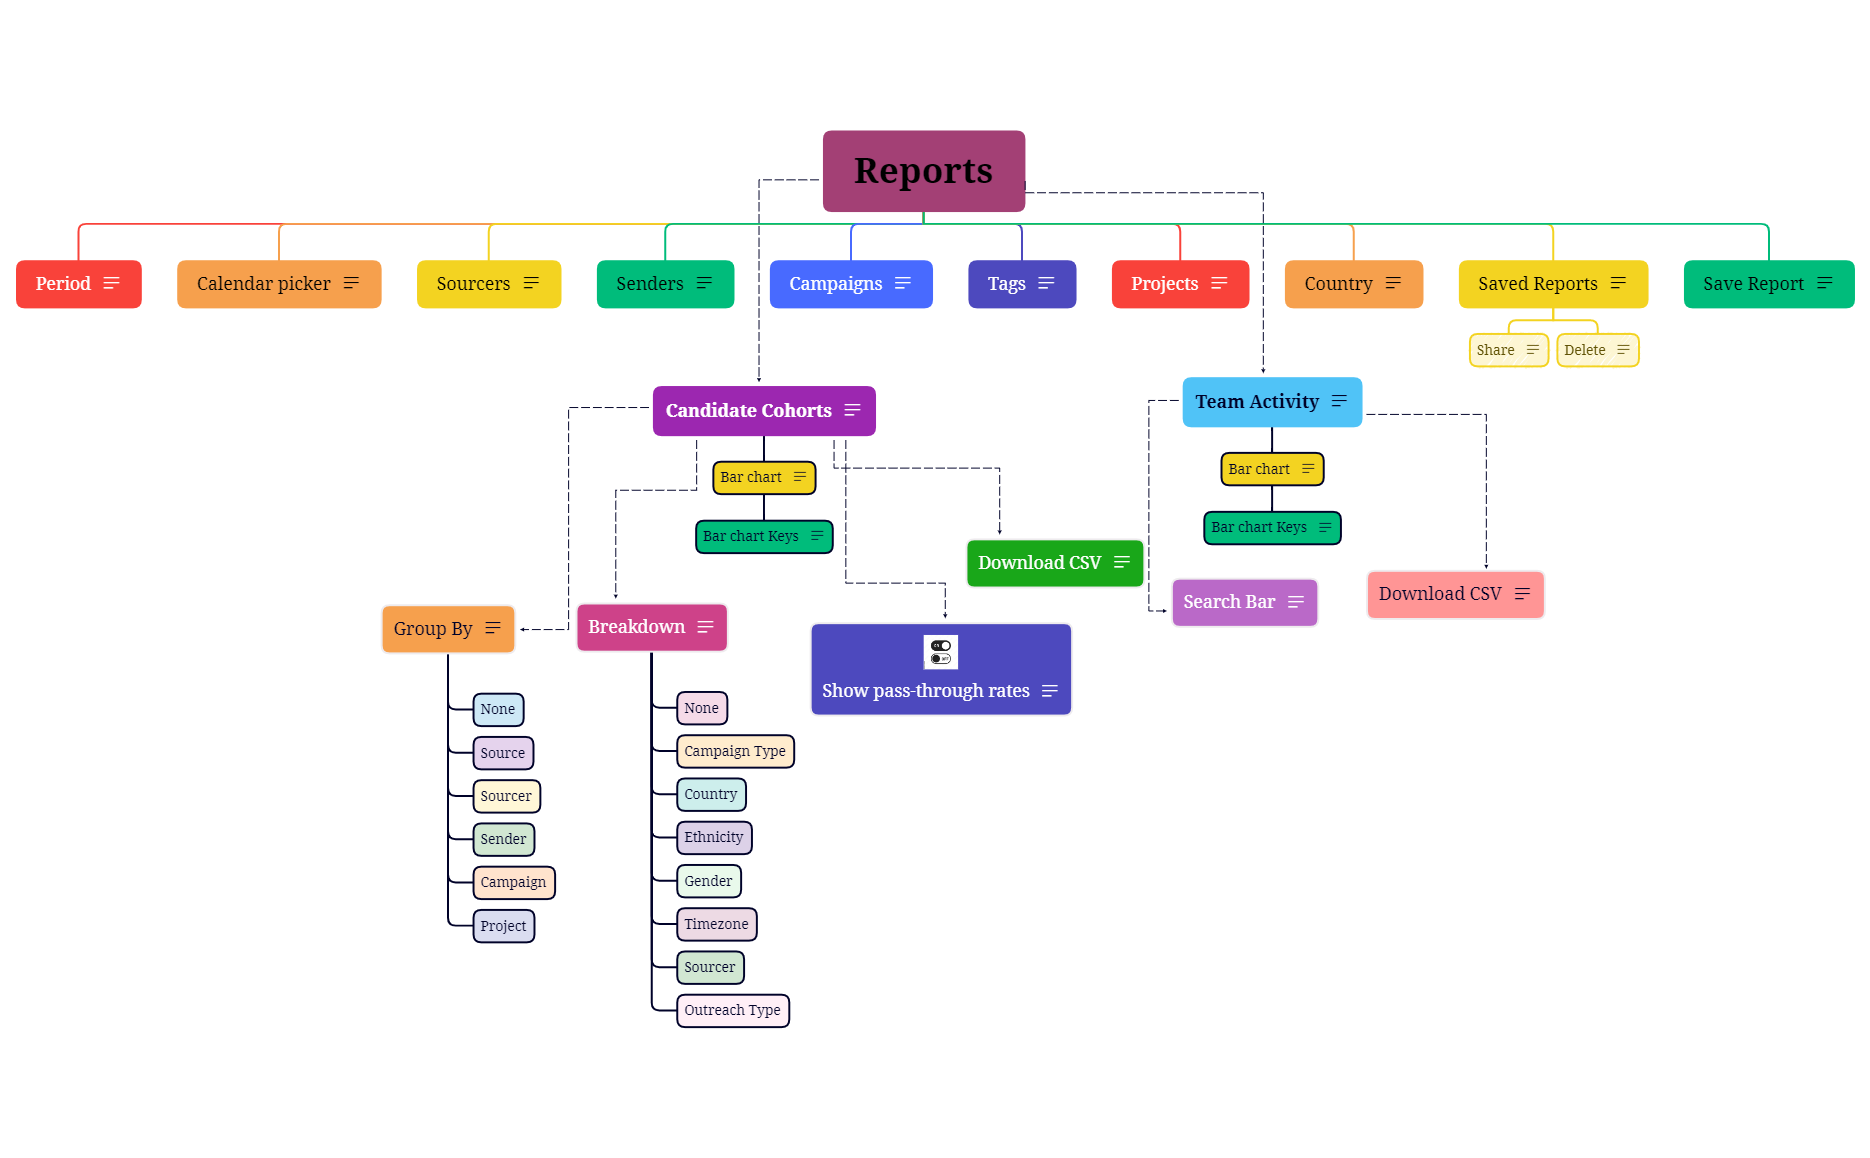
The Reports mind map template organizes 39 nodes across a single sheet, providing a structured overview for report generation and analysis. It covers candidate cohorts, team activity, and project management with specific nodes like 'Candidate Cohorts', 'Team Activity', and 'Group By'. This template serves as a cheat sheet for HR, recruiting, and operations teams who need to track sourcing metrics, campaign performance, and team productivity. Key branches include 'Period', 'Sourcers', 'Campaigns', 'Projects', and 'Saved Reports', with granular breakdown options such as 'Country', 'Ethnicity', and 'Gender'. The layout is designed as a central 'Reports' topic with radiating sub-branches, making it easy to navigate and customize for specific reporting needs.
Conditions d'utilisationMonthly recruiting performance review to analyze sourcer and campaign effectiveness.
Quarterly diversity hiring assessment using the 'Breakdown' by 'Ethnicity' and 'Gender'.
Weekly team stand-up to review 'Team Activity' and individual contributions.
Launch the .xmind file in Xmind Desktop or Web to begin customizing the central report structure for your organization.
Replace the placeholder nodes under Sourcers, Campaigns, and Projects with your specific team names and campaign details.
Adjust the Candidate Cohorts and Group By nodes to your preferred segmentation before saving or exporting your final report.
The template includes 39 nodes covering Period, Sourcers, Senders, Campaigns, Tags, Projects, Country, Saved Reports, Candidate Cohorts, Group By, Breakdown, Team Activity, and more. It also features bar charts for candidate cohorts and team activity.
Use the 'Sourcers' and 'Senders' nodes to track who is sourcing and sending candidates. The 'Group By' option lets you segment by 'Source' or 'Sourcer', while 'Breakdown' can filter by 'Country' or 'Ethnicity'.
Yes, you can edit the 'Group By' and 'Breakdown' nodes to add or remove options like 'Campaign', 'Project', or 'Gender' to match your reporting needs.
Absolutely. The 'Team Activity' section with its bar chart helps visualize individual or team metrics. You can also use 'Sourcers' and 'Senders' to attribute activity to specific team members.
The 'Saved Reports' node includes 'Share' and 'Delete' sub-nodes, allowing you to manage saved configurations. You can also use the 'Download CSV' option to export data.
Partagez vos modèles de cartes mentales avec des créateurs du monde entier et commencez à gagner avec votre travail.

