

Marketing managers and content designers
Planning a marketing campaign that requires a data-driven infographic to explain complex product features.
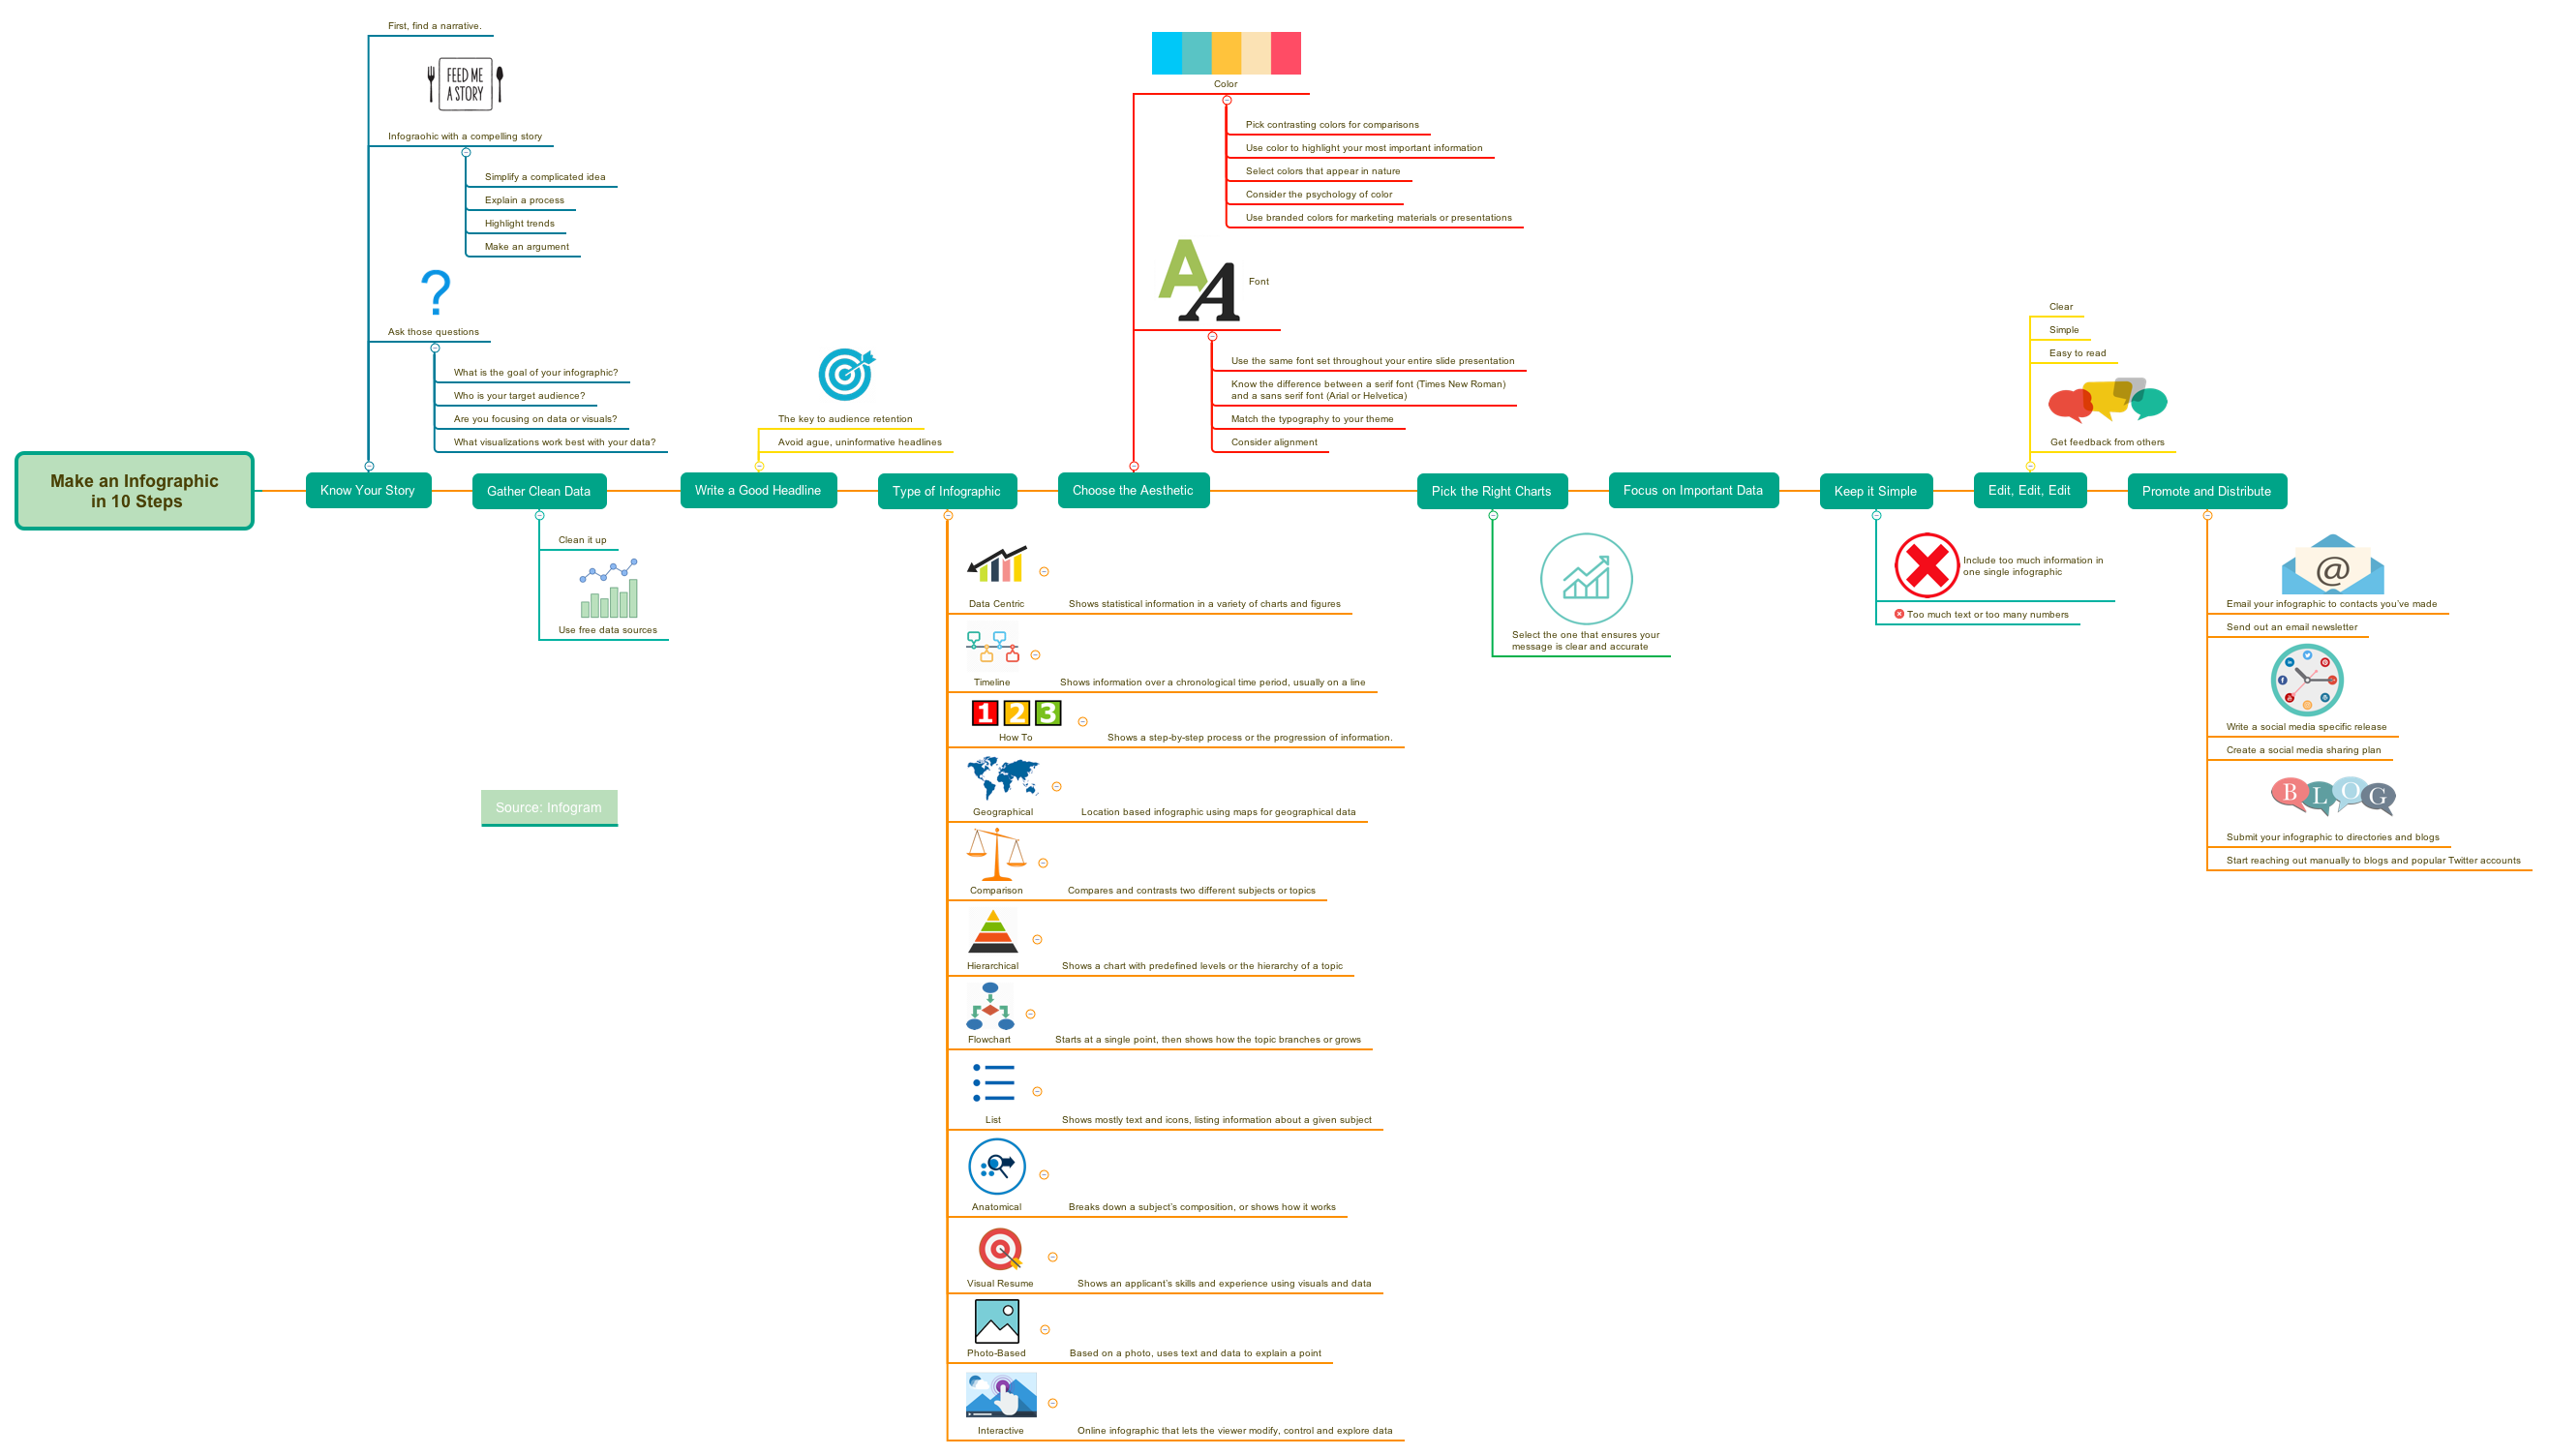
The 'Make an Infographic in 10 Steps' mind map template, created by Infogram, provides a structured 10-step framework for designing effective infographics. It covers narrative development, data cleaning, headline writing, infographic types (Data Centric, Timeline, How To, Geographical, Comparison, Hierarchical, Flowchart, List, Anatomical, Visual Resume, Photo-Based, Interactive), aesthetic choices (color and font), chart selection, simplification, editing, and promotion. This template is ideal for marketers, designers, and content creators who want to produce clear, engaging infographics. Key nodes include 'Know Your Story', 'Gather Clean Data', and 'Write a Good Headline'.
使用条款Planning a marketing campaign that requires a data-driven infographic to explain complex product features.
Designing an educational infographic for a classroom or online course to simplify a scientific process.
Creating a visual resume for a job application to highlight skills and experience in a compelling format.
Open the template in Xmind to explore the 10-step framework ranging from narrative development to final distribution.
Replace the placeholder text in each branch with your specific data and use Xmind's tools to adjust colors and fonts.
Review your completed infographic plan for clarity before exporting it as an image or PDF to share with your team.
The template contains 75 nodes across 10 steps: Know Your Story, Gather Clean Data, Write a Good Headline, Type of Infographic, Choose the Aesthetic, Pick the Right Charts, Focus on Important Data, Keep it Simple, Edit Edit Edit, and Promote and Distribute. It also includes a source credit to Infogram.
Open the .xmind file in Xmind, then follow each step from top to bottom. Start by defining your story and audience, then gather clean data, write a headline, select an infographic type, choose colors and fonts, pick the right charts, focus on key data, simplify, edit thoroughly, and finally promote your infographic.
Yes, the template lists 11 types (e.g., Data Centric, Timeline, How To, Comparison, Flowchart). You can add or remove types by editing the branches in Xmind to match your project needs.
Yes, the template is free to use and fully editable in Xmind (desktop or web). You can modify any node, add new branches, and customize colors and fonts to fit your brand.
The 'Promote and Distribute' step suggests emailing contacts, sending newsletters, writing social media releases, creating a sharing plan, submitting to directories, and reaching out to blogs and influencers.
把你的思维导图模板分享给全球创作者,从你的作品中获得收益。

