




Financial analysts and FP&A managers
Quarterly financial review meetings where the team needs to explain revenue variances and forecast adjustments.
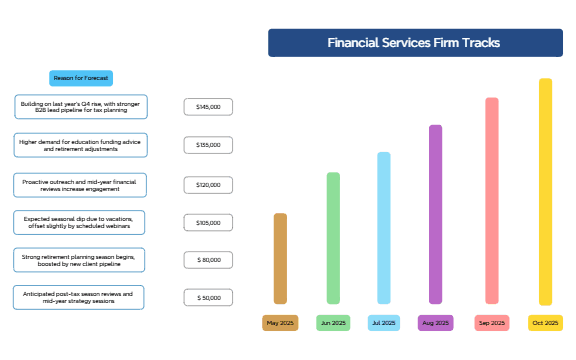
The Revenue Growth and Forecast Charts mind map template provides a structured framework for financial services firms to track monthly revenue projections and underlying drivers. Covering six months from May to October 2025, it maps forecasted revenue figures ranging from $50,000 to $145,000 alongside contextual 'Reason for Forecast' nodes. Key factors include 'Building on last year’s Q4 rise, with stronger B2B lead pipeline for tax planning' and 'Higher demand for education funding advice and retirement adjustments'. This template serves as a practical cheat sheet for financial planners and analysts to visualize revenue trends and seasonal patterns. Organized as a vertical timeline with paired revenue and reason branches, it enables quick comparison of month-over-month changes. The structure includes six monthly pairs, each with a dollar amount and a narrative driver, making it ideal for strategic review sessions. By linking quantitative forecasts to qualitative insights, this revenue growth template helps teams align on expectations and proactively adjust strategies.
Terms and ConditionsQuarterly financial review meetings where the team needs to explain revenue variances and forecast adjustments.
Annual budgeting process to align sales and marketing efforts with expected revenue peaks and troughs.
Investor or board presentations requiring a clear visual of revenue trajectory and underlying business drivers.
Open the .xmind file in Xmind Desktop, Web, or Mobile app.
Review the six monthly pairs (May–Oct 2025) and replace the sample revenue figures with your own forecasts.
Edit each 'Reason for Forecast' node to reflect your specific business drivers, such as pipeline changes or seasonal trends.
Add or remove months by duplicating or deleting node pairs to extend the forecast period as needed.
Customize colors, icons, or layout to match your branding, then export as PDF or image for sharing.
The template includes six monthly revenue forecasts (May to October 2025) with dollar amounts and corresponding 'Reason for Forecast' nodes explaining the drivers behind each projection.
Open the .xmind file in Xmind, then replace the sample revenue figures and reasons with your own data. Adjust the months and add new branches as needed to extend the forecast period.
Yes, the template is fully editable in Xmind. You can customize nodes, add icons, and export as PDF or image for printing or sharing.
Use the timeline layout to show month-over-month trends. Present each month's revenue alongside its key driver to tell a compelling story about growth drivers and seasonal effects.
Absolutely. Each reason node is a text field you can edit to reflect your own market conditions, pipeline changes, or strategic initiatives.
Share your mind map templates with creators around the world and start earning from your work.

