




Data engineers and BI developers
Kicking off a new real-time dashboard development project to ensure all technical requirements are captured.
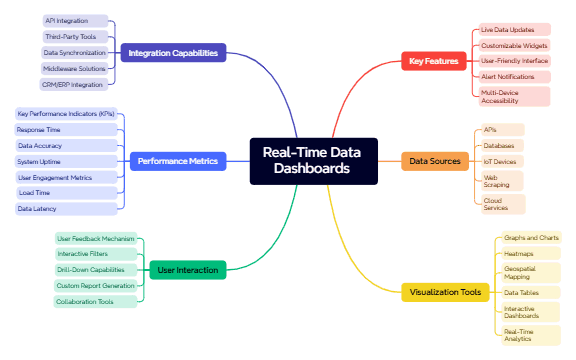
The Real-Time Data Dashboards mind map provides a structured overview of 40 key components across 6 major branches, covering everything from live data updates to CRM/ERP integration. This template is designed for data analysts, BI developers, and IT managers who need a comprehensive cheat sheet for building or evaluating real-time dashboard solutions. It includes specific nodes such as 'Key Performance Indicators (KPIs)', 'Data Latency', and 'Drill-Down Capabilities', offering a clear taxonomy of essential features, data sources, visualization tools, user interaction methods, performance metrics, and integration capabilities. The map is organized as a radial mind map with six color-coded branches, making it easy to navigate and customize in Xmind for project planning or system design.
利用規約Kicking off a new real-time dashboard development project to ensure all technical requirements are captured.
Evaluating existing dashboard solutions for a vendor selection process, comparing features and integrations.
Preparing for a stakeholder presentation to outline dashboard capabilities and performance metrics.
Open the .xmind file in Xmind Desktop or Xmind Web (free or pro version).
Review the six main branches and expand each to see the detailed nodes.
Replace placeholder node names with your own project-specific terms (e.g., change 'APIs' to your actual API endpoints).
Add new child nodes under any branch to capture additional requirements or notes.
Export the completed mind map as an image, PDF, or share it with your team via Xmind Cloud.
The template covers 6 major branches: Key Features, Data Sources, Visualization Tools, User Interaction, Performance Metrics, and Integration Capabilities, with 40 specific nodes like 'Live Data Updates', 'Heatmaps', and 'Data Latency'.
Open the .xmind file in Xmind, then expand each branch to brainstorm requirements. For example, under 'Data Sources', list your specific APIs and databases; under 'Visualization Tools', choose the chart types you need.
Yes, it's fully editable in Xmind. You can add new nodes, modify existing ones, and reorganize branches to fit your project's specific needs.
The template includes KPIs, response time, data accuracy, system uptime, user engagement metrics, load time, and data latency.
Yes, the 'Integration Capabilities' branch covers API integration, third-party tools, data synchronization, middleware, and CRM/ERP integration, providing a checklist for system interoperability.
あなたのマインドマップ テンプレートを世界中のクリエイターと共有して、作品から収入を得ましょう。

