

Operations managers and process improvement teams
During a quarterly process review to identify which onboarding steps cause the most delays or errors.
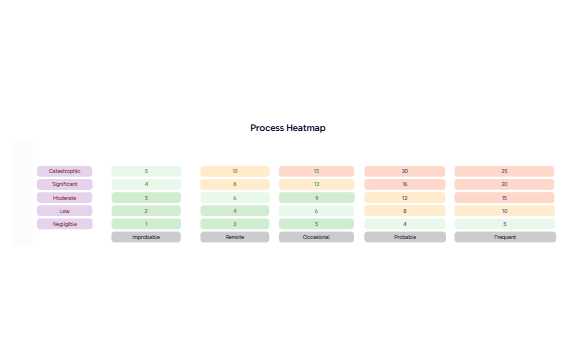
The Process Heatmap – Customer Onboarding Process template provides a structured 5×6 matrix for visualizing bottlenecks and inefficiencies across six key metrics: Process Step, Time to Complete, Error Rate, Employee Effort, Customer Satisfaction, and Main Topic 6. Each metric is rated on a five-point scale (e.g., Catastrophic to Negligible for Process Step, or 5 to 1 for Time to Complete) with an additional frequency dimension (Improbable to Frequent). This heatmap enables teams to pinpoint high-risk areas and optimize resource allocation. The template includes 42 nodes organized into a single sheet, making it ideal for operational reviews and continuous improvement initiatives.
使用條款During a quarterly process review to identify which onboarding steps cause the most delays or errors.
When onboarding new clients and you want to proactively map risk areas before launch.
In a Lean Six Sigma workshop to teach teams how to visualize waste and prioritize kaizen events.
Open the .xmind file in Xmind Desktop, Web, or Mobile.
Review the six metric branches (e.g., 'Time to Complete', 'Error Rate') and their sub-nodes representing severity and frequency.
For each process step in your workflow, assign a rating by editing the node values or adding new branches under each metric.
Color-code cells (e.g., red for high severity + high frequency) to visually highlight bottlenecks.
Export the completed heatmap as an image or PDF to share with stakeholders during review meetings.
It includes a single-sheet mind map with six metrics: Process Step, Time to Complete, Error Rate, Employee Effort, Customer Satisfaction, and Main Topic 6. Each metric has a five-point severity scale and a frequency dimension, totaling 42 nodes.
Assign each process step a rating on the severity and frequency scales. High-severity items (e.g., 'Catastrophic') combined with high-frequency (e.g., 'Frequent') indicate critical bottlenecks that need immediate optimization.
Yes. You can rename the severity levels (e.g., change 'Catastrophic' to 'Critical') or adjust the numeric values to match your organization's scoring system. All nodes are fully editable.
Absolutely. The structure is generic—you can replace 'Customer Onboarding' with any workflow (e.g., software deployment, manufacturing) and reuse the same heatmap logic.
Error Rate uses a numeric scale from 10 (highest) down to 2 (lowest), plus a 'Remote' frequency tag. This helps quantify defect frequency and severity across process steps.
把你的心智圖範本分享給全球創作者,從你的作品中獲得收益。

