



Beginner investors and financial advisors
Building a first-time investment portfolio and comparing asset classes.
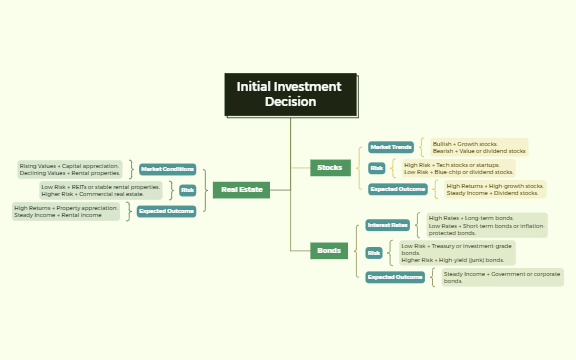
The Initial Investment Decision mind map template provides a structured framework for evaluating three primary asset classes: Stocks, Real Estate, and Bonds. It covers 22 nodes across market trends, risk levels, and expected outcomes, helping investors match strategies to conditions. For instance, under Stocks, 'Bullish → Growth stocks' and 'Bearish → Value or dividend stocks' guide market-based choices. The template also details 'Low Risk → REITs or stable rental properties' for Real Estate and 'High Rates → Long-term bonds' for Bonds. This Xmind template serves as a cheat sheet for balancing risk and return in initial portfolio decisions.
NutzungsbedingungenBuilding a first-time investment portfolio and comparing asset classes.
Re-evaluating asset allocation during market shifts (e.g., rising interest rates).
Teaching or learning the fundamentals of stocks, bonds, and real estate risk-return profiles.
Open the .xmind file in Xmind desktop or web app.
Review the three main branches: Stocks, Real Estate, and Bonds.
Click on any node (e.g., 'Bullish → Growth stocks') to edit text with your own data.
Add new sub-nodes by pressing Tab or Insert to expand your analysis.
Customize colors, icons, or attachments to highlight your preferred investment choices.
The template covers three asset classes: Stocks, Real Estate, and Bonds. Each includes sub-branches for market trends, risk levels, and expected outcomes, with specific examples like growth stocks, REITs, and treasury bonds.
Navigate the Stocks branch to assess Market Trends (Bullish or Bearish), choose a Risk level (High for tech startups, Low for blue-chip), and align with Expected Outcome (High Returns or Steady Income). Replace examples with your own research.
Yes, the template is free to use in Xmind (desktop or web). You can edit all nodes, add your own data, and customize colors or icons to fit your investment analysis.
Use the Real Estate branch: check Market Conditions (Rising Values for appreciation, Declining for rentals), assess Risk (REITs for low, commercial for high), and set Expected Outcome (capital appreciation or rental income).
Absolutely. The template provides example risk categories like 'Low Risk → Blue-chip stocks' and 'Higher Risk → High-yield bonds'. You can rename or add new risk levels and link them to your preferred assets.
Teilen Sie Ihre Mindmap-Vorlagen mit Erstellern weltweit und verdienen Sie mit Ihrer Arbeit.

