




HR leaders and change management consultants
Announcing a major organizational restructuring that may cause employee anxiety and resistance
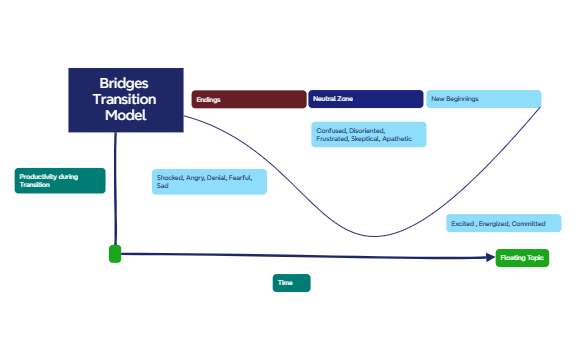
The Bridges Transition Model mind map template breaks down William Bridges' framework for navigating personal and organizational change into three core phases: Endings, Neutral Zone, and New Beginnings. It maps 11 key emotional states—including 'Shocked, Angry, Denial, Fearful, Sad' and 'Confused, Disoriented, Frustrated, Skeptical, Apathetic'—alongside a 'Productivity during Transition' curve that shows performance dips and recoveries over 'Time'. This Bridges Transition Model template helps leaders, coaches, and change managers visualize the psychological journey of transition, making it an essential cheat sheet for guiding teams through change. The layout uses a horizontal timeline with color-coded emotional clusters, making it easy to identify where individuals or groups are in the process.
Условия использованияAnnouncing a major organizational restructuring that may cause employee anxiety and resistance
Coaching a client through a career transition or personal loss where they feel stuck in the Neutral Zone
Planning a communication strategy for a merger or acquisition to address emotional stages
Open the .xmind file in Xmind (desktop, web, or mobile app).
Review the three main phases: Endings, Neutral Zone, and New Beginnings. Add specific events or changes under each phase.
Customize the emotional state nodes (e.g., 'Shocked, Angry, Denial') by editing text or adding icons to match your team's actual feelings.
Adjust the 'Productivity during Transition' curve by dragging nodes to reflect your observed productivity levels over time.
Export the completed mind map as an image, PDF, or share it directly with stakeholders via Xmind Cloud.
It's a framework for understanding the psychological process people go through during change, focusing on three phases: Endings, Neutral Zone, and New Beginnings. It helps leaders manage resistance and support teams through transitions.
The template covers the three phases—Endings, Neutral Zone, New Beginnings—plus emotional states like 'Shocked, Angry, Denial, Fearful, Sad', a productivity curve, and a time axis. It's a complete visual guide for change management.
Open the .xmind file in Xmind, then customize the emotional states and productivity curve to match your team's situation. Use it in workshops to identify where employees are in the transition and plan interventions.
Yes, it's fully editable in Xmind (desktop, web, or mobile). You can add notes, change colors, and export as PDF or image for printing or sharing.
Absolutely. The template's emotional categories and productivity timeline apply to personal changes like career shifts or life events. Adapt the nodes to reflect your client's specific feelings and progress.
Поделитесь своими шаблонами интеллект-карт с авторами по всему миру и начните зарабатывать на своих работах.
