




Portfolio managers and automotive analysts
Evaluating Tesla's product lineup for investment or divestment decisions
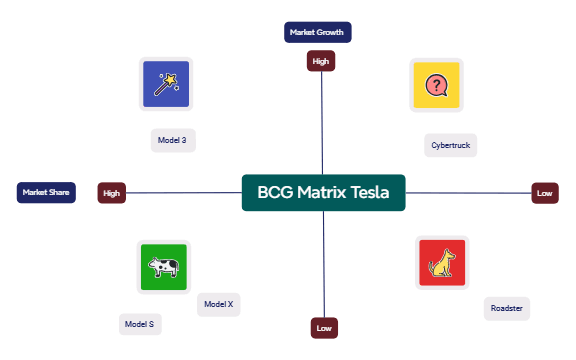
The BCG Matrix Tesla mind map template provides a strategic portfolio analysis of Tesla's vehicle lineup using the Boston Consulting Group (BCG) framework. It maps key models—Model 3, Cybertruck, Model S, Roadster, and Model X—across the four quadrants (Stars, Cash Cows, Question Marks, Dogs) based on Market Growth and Market Share. This template helps business analysts and strategists evaluate which Tesla products drive growth, generate cash, or require divestment. The structure includes nodes for High and Low market growth and market share, enabling quick classification. With 16 nodes across a single sheet, it offers a concise yet comprehensive BCG Matrix cheat sheet for automotive portfolio analysis.
Termos e condiçõesEvaluating Tesla's product lineup for investment or divestment decisions
Presenting a strategic overview of Tesla's competitive positioning in board meetings
Teaching BCG Matrix concepts with a real-world example in business classes
Open the .xmind file in Xmind (desktop or web version).
Review the four quadrants defined by Market Growth and Market Share axes.
Drag each Tesla model node (e.g., Model 3, Cybertruck) into the appropriate quadrant based on your analysis.
Add notes or color-code nodes to indicate strategic recommendations (invest, hold, harvest, divest).
Export the completed matrix as an image or PDF for presentations.
It is used to analyze Tesla's product portfolio by categorizing models like Model 3, Cybertruck, and Model S into Stars, Cash Cows, Question Marks, or Dogs based on market growth and market share.
Open the .xmind file in Xmind, then drag each Tesla model node into the appropriate quadrant (High/Low growth and share). Customize labels and add notes to reflect your strategic assessment.
Yes, the template is free to download and fully editable in Xmind. You can modify node names, add new models, or adjust the matrix layout.
They represent the two dimensions of the BCG Matrix: Market Growth (High/Low) and Market Share (High/Low). Together they define the four quadrants for portfolio analysis.
Absolutely. You can replace the Tesla model names with any product or business unit to perform a BCG analysis for any company.
Compartilhe seus modelos de mapas mentais com criadores ao redor do mundo e comece a ganhar com seu trabalho.

