

Product managers and brand strategists
During quarterly portfolio review meetings to decide which Nike product lines to invest in or phase out.
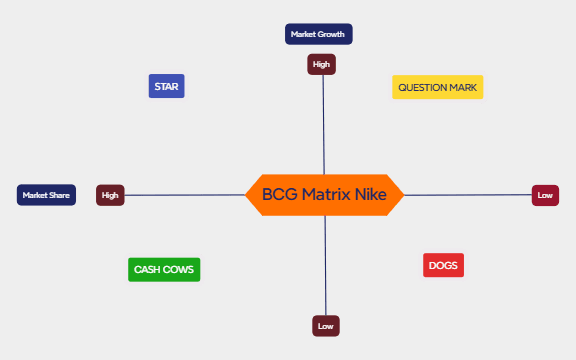
The BCG Matrix Nike template applies the Boston Consulting Group (BCG) growth-share matrix to Nike's product portfolio, categorizing products into Stars, Cash Cows, Question Marks, and Dogs based on market growth and market share. This strategic analysis tool helps identify which Nike products (e.g., Air Jordan, Dri-FIT apparel) require investment, generate steady revenue, or should be divested. The template includes four quadrants—High/Low Market Growth paired with High/Low Market Share—and features nodes like 'STAR' and 'CASH COWS' for direct placement of products. Ideal for marketing managers and business strategists, this BCG Matrix mind map provides a visual framework for portfolio optimization, competitive analysis, and resource allocation. With 11 nodes organized in a 2x2 grid layout, it offers a clear, editable structure for evaluating Nike's diverse product lines.
使用條款During quarterly portfolio review meetings to decide which Nike product lines to invest in or phase out.
When launching a new Nike product category (e.g., sustainable footwear) to assess its growth potential and competitive position.
In competitive analysis workshops comparing Nike's product portfolio against rivals like Adidas or Under Armour.
Download the BCG Matrix Nike .xmind file and open it in Xmind (desktop, web, or mobile app).
Review the four quadrants: Stars, Cash Cows, Question Marks, and Dogs, each defined by Market Growth and Market Share axes.
Replace the placeholder node names with actual Nike products (e.g., 'Air Jordan' under Stars, 'Classic Socks' under Cash Cows).
Adjust the position of each product node within its quadrant to reflect relative market share and growth (e.g., higher placement = higher growth).
Add notes, icons, or color codes to highlight strategic actions (e.g., invest, harvest, divest) for each product.
The template includes a 2x2 BCG matrix with four quadrants—Stars, Cash Cows, Question Marks, and Dogs—plus nodes for Market Growth and Market Share. It's pre-labeled for Nike product analysis but fully editable.
Open the .xmind file in Xmind, then drag each Nike product (e.g., Air Max, Dri-FIT) into the appropriate quadrant based on its market growth and relative market share. Customize colors and notes as needed.
Yes, the template is free to download and fully editable in Xmind (desktop, web, or mobile). You can add, remove, or rename nodes to fit your specific product portfolio.
Stars (high growth, high share) require investment to sustain growth, while Cash Cows (low growth, high share) generate steady profits with low investment. The template helps visualize this distinction for Nike's products.
Absolutely. The BCG Matrix structure is generic—just replace 'Nike' with your brand name and adjust product nodes. The template works for any company's product portfolio analysis.
把你的心智圖範本分享給全球創作者,從你的作品中獲得收益。

