




Product managers and corporate strategists
During annual strategic planning to evaluate the product portfolio and decide resource allocation across business units.
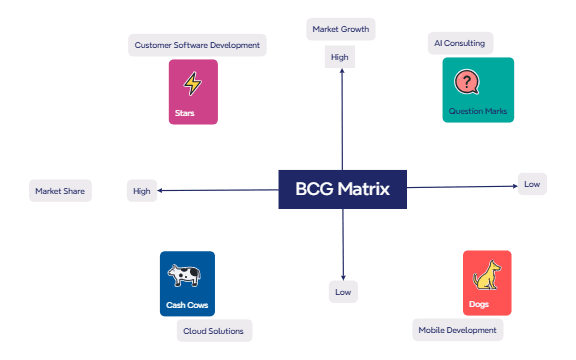
The BCG Matrix mind map template is a strategic tool used by product managers, business analysts, and marketing teams to categorize a company's product portfolio based on market growth and relative market share. This Xmind template covers the four classic quadrants—Stars, Question Marks, Cash Cows, and Dogs—and includes example products such as Customer Software Development, AI Consulting, Mobile Development, and Cloud Solutions. The matrix is structured with two axes: Market Growth (High/Low) and Market Share (High/Low), enabling quick visual identification of investment priorities and resource allocation. By mapping products onto this 2x2 grid, teams can decide which products to invest in, divest, or maintain. The template serves as both a BCG Matrix cheat sheet and a ready-to-use BCG Matrix template for strategic planning sessions.
Términos y condicionesDuring annual strategic planning to evaluate the product portfolio and decide resource allocation across business units.
When preparing a pitch to investors, showing which products drive growth and which generate cash.
In a product team retrospective to identify underperforming products (Dogs) and high-potential bets (Question Marks).
Download and open the BCG Matrix .xmind file in Xmind (desktop, web, or mobile app).
Review the four quadrants: Stars, Cash Cows, Question Marks, and Dogs, along with the example products.
Replace the example products (e.g., AI Consulting) with your own products or business units by editing the node text.
Adjust the position of products within the matrix by dragging nodes to reflect their actual market growth and share.
Customize colors, add notes, or attach files to each quadrant for deeper analysis, then export as an image or PDF.
The template includes the four BCG quadrants (Stars, Cash Cows, Question Marks, Dogs) with example products like AI Consulting and Cloud Solutions, plus axes for Market Growth and Market Share.
Open the .xmind file in Xmind, then replace the example products under each quadrant with your own products or business units to visualize their strategic position.
Yes, the template is free to use and fully editable in Xmind (desktop, web, or mobile). You can customize colors, add notes, or rearrange nodes.
Use the template to map your products, then export as an image or PDF from Xmind. The clear quadrant layout makes it easy to explain investment priorities.
Absolutely. Simply add new child nodes under the appropriate quadrant (Stars, Cash Cows, etc.) to include additional products or business units.
Comparte tus plantillas de mapas mentales con creadores de todo el mundo y empieza a ganar con tu trabajo.

