




Graduate students and researchers in public health or psychology
Preparing a literature review on racial disparities in ADHD diagnosis
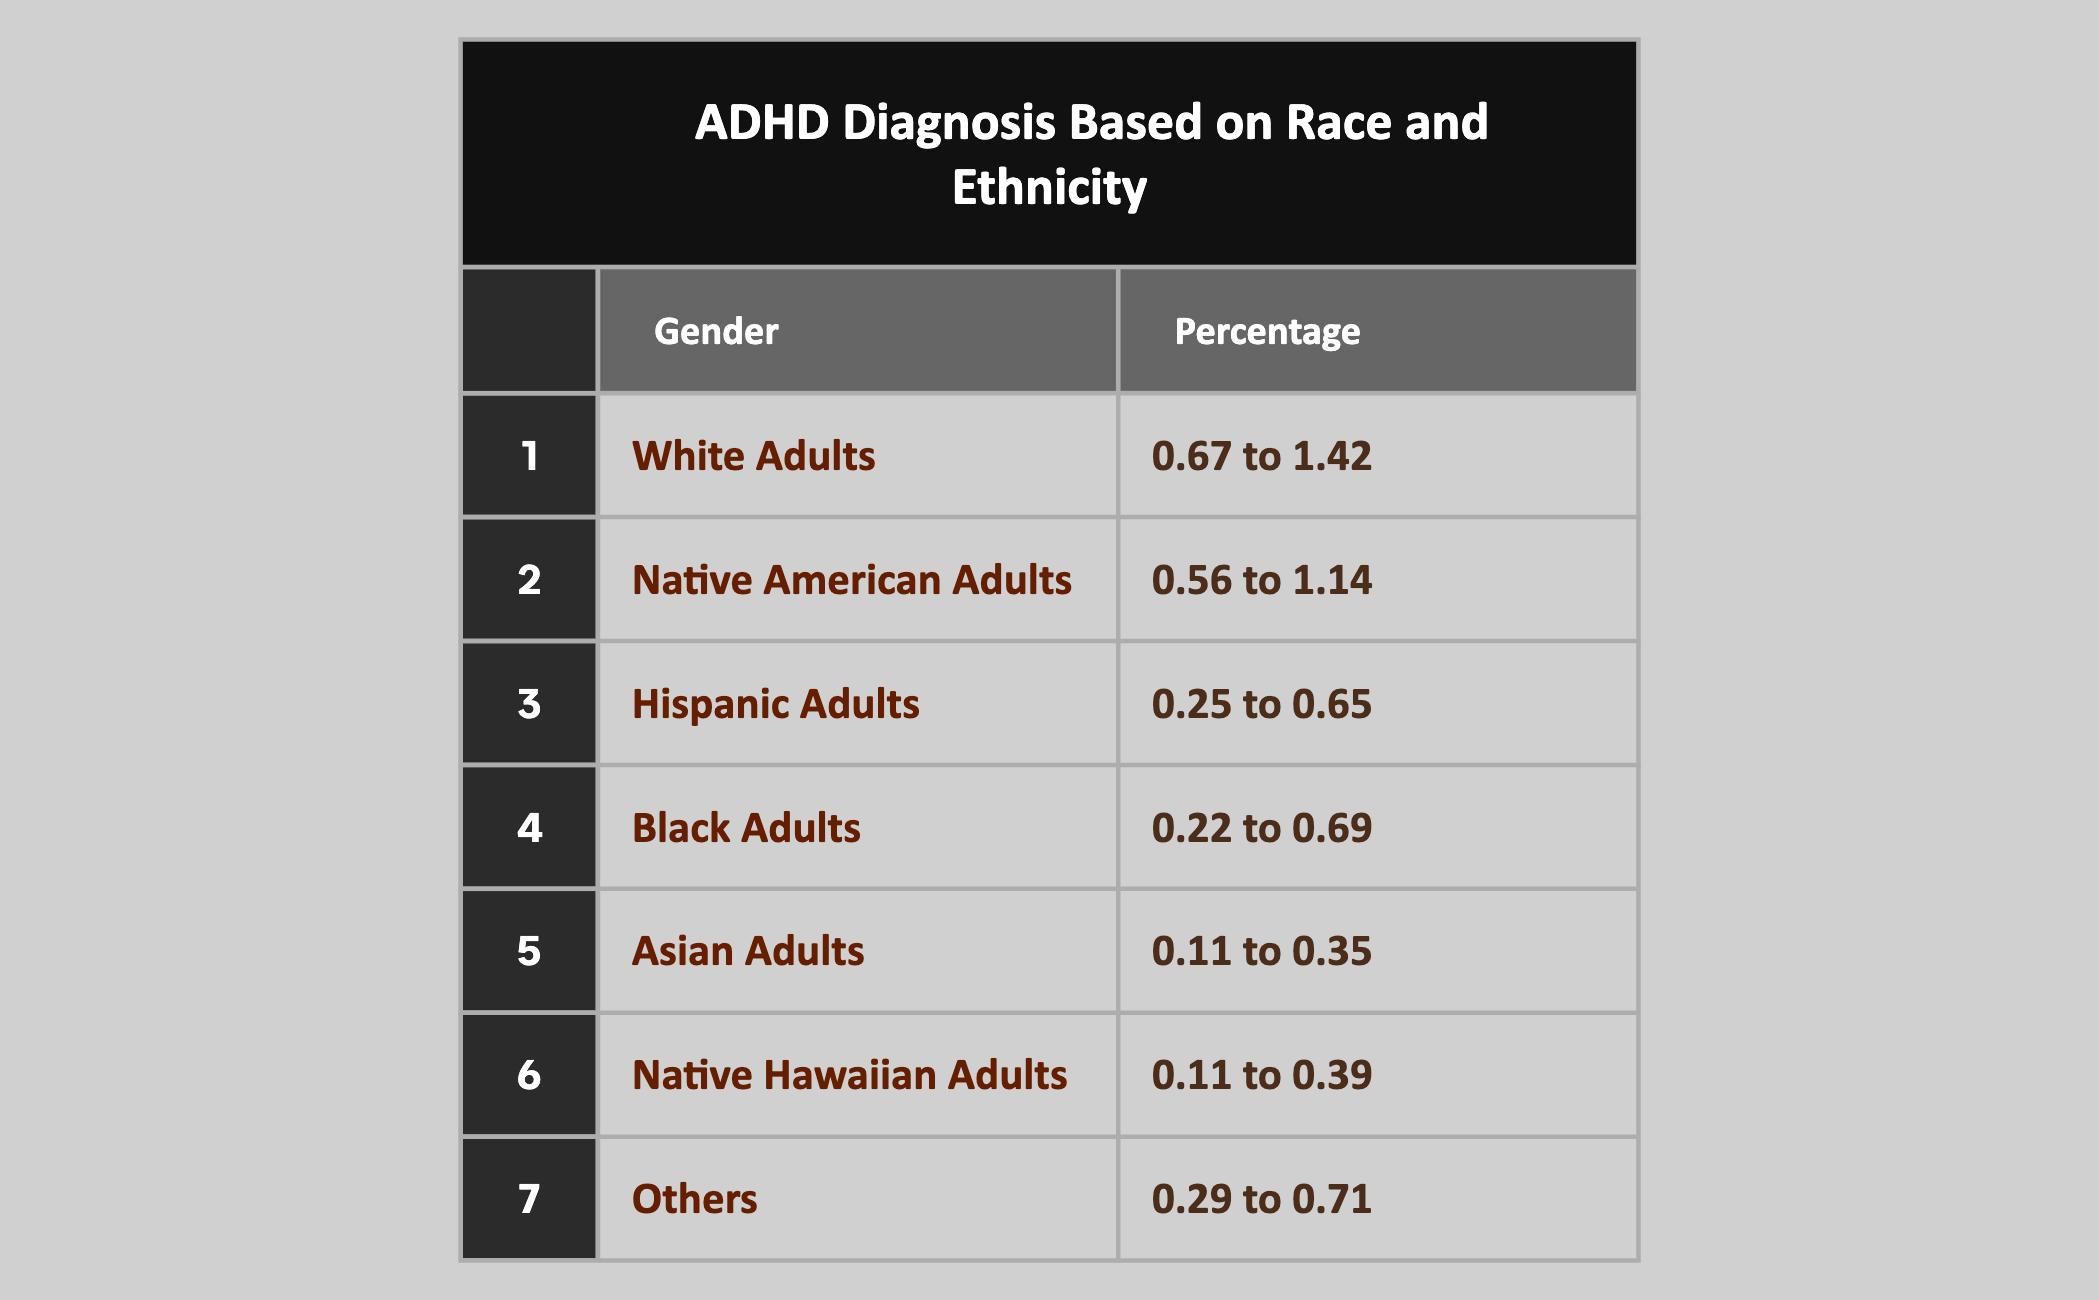
The ADHD Diagnosis Based on Race and Ethnicity mind map template provides a structured analysis of ADHD diagnosis rates across seven racial and ethnic groups in the United States, including White Adults, Black Adults, Hispanic Adults, Asian Adults, Native American Adults, Native Hawaiian Adults, and Others. It breaks down data by Gender and Percentage ranges, offering specific numerical intervals such as 0.56 to 1.14 for White Adults and 0.11 to 0.35 for Asian Adults. This template serves as a concise reference for researchers, clinicians, and educators examining disparities in ADHD diagnosis. By organizing key statistics into a visual format, it facilitates quick comparisons and highlights the impact of race and ethnicity on diagnostic rates. The inclusion of gender as a top-level branch underscores the intersectionality of race and gender in ADHD diagnosis.
Условия использованияPreparing a literature review on racial disparities in ADHD diagnosis
Designing a clinical training module on culturally competent ADHD assessment
Analyzing population health data for a grant proposal on health equity
Open the .xmind file in Xmind Desktop or Xmind Web to view the template.
Review the two main branches: Gender and Percentage, which organize the racial groups and their diagnosis ranges.
Click on any node to edit the text, such as updating percentage ranges or adding new racial groups.
Add child nodes under each racial group to include subcategories (e.g., age groups or gender-specific data).
Export the final mind map as an image, PDF, or shareable link for presentations or reports.
The template covers White, Native American, Hispanic, Black, Asian, Native Hawaiian, and Other adults, providing percentage ranges for each group.
Data is organized under two main branches: Gender (listing racial groups) and Percentage (showing numerical ranges for each group).
Yes, you can edit the percentage values directly in Xmind to reflect updated research or specific datasets.
Yes, it provides a clear visual summary of disparities, suitable for presentations, papers, or classroom discussions.
The Gender branch lists racial groups, but does not subdivide by male/female; however, you can add child nodes for further granularity.
Поделитесь своими шаблонами интеллект-карт с авторами по всему миру и начните зарабатывать на своих работах.
