




Academic researchers and graduate students
Preparing a research poster on ADHD prevalence differences between genders
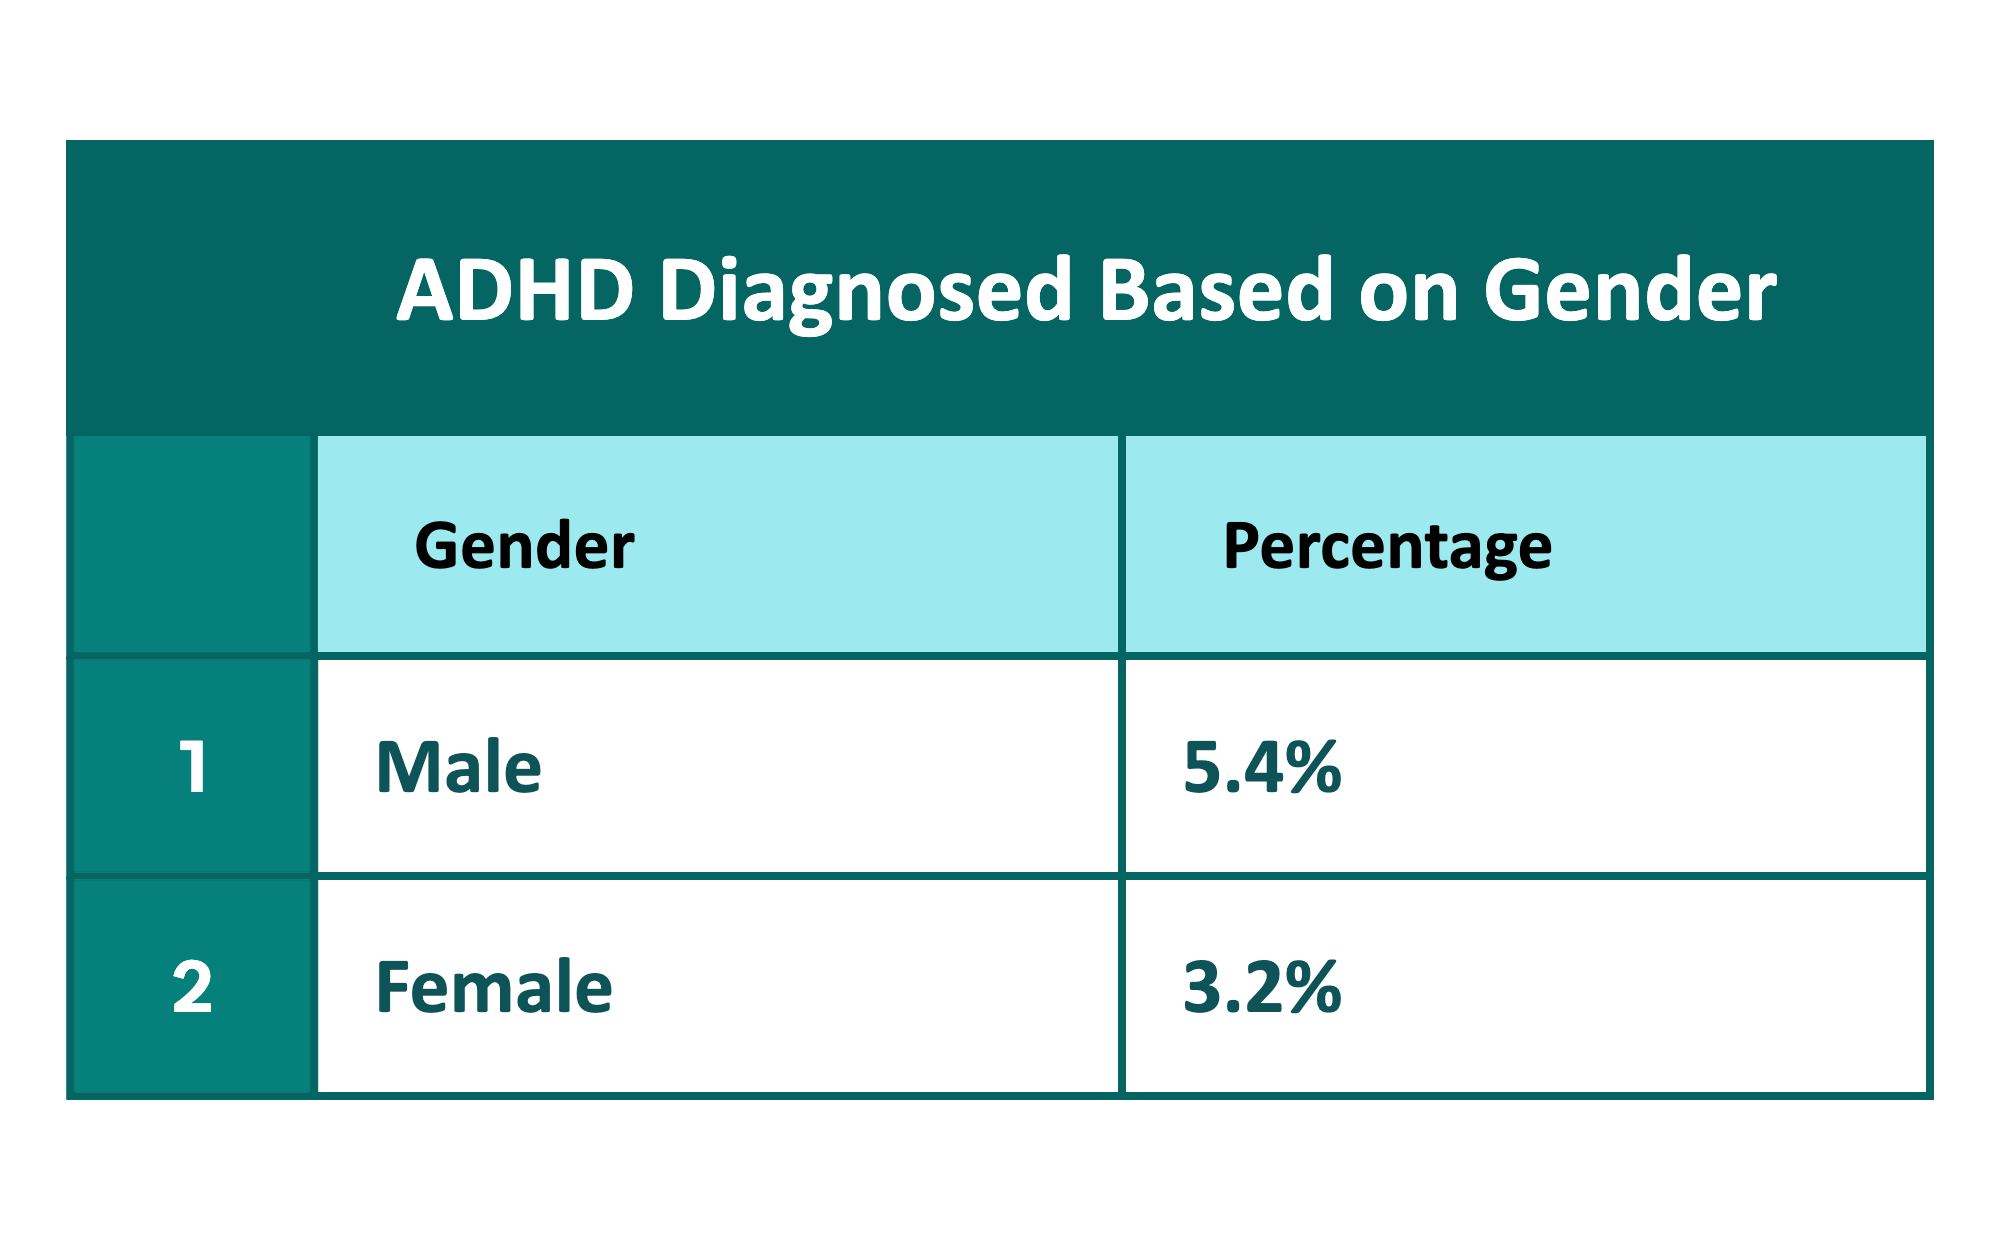
The ADHD Diagnosed Based on Gender mind map template breaks down ADHD diagnosis rates by gender, presenting data for Male and Female categories with specific percentages (3.2% for males and 5.4% for females). This template is used by researchers, clinicians, and educators to visualize gender disparities in ADHD diagnoses. It includes nodes such as 'Gender' and 'Percentage' to organize the comparison clearly. The structure is simple yet effective for highlighting the difference in diagnosis rates between genders, making it a useful tool for presentations, reports, or further analysis in academic or medical settings.
使用條款Preparing a research poster on ADHD prevalence differences between genders
Creating a clinical training module to highlight gender bias in ADHD diagnosis
Developing a public health infographic on ADHD diagnosis disparities
Open the .xmind file in Xmind (desktop or web app).
Review the existing nodes: Gender (Male, Female) and Percentage (3.2%, 5.4%).
Replace the percentage values with your own data or verified statistics.
Add additional branches (e.g., age groups, subtypes) by right-clicking and selecting 'Add Topic'.
Export the mind map as an image, PDF, or presentation slide for sharing.
The template includes two main branches: 'Gender' (with Male and Female subnodes) and 'Percentage' (showing 3.2% for males and 5.4% for females). It provides a simple comparison of ADHD diagnosis rates by gender.
You can use it to present or analyze gender disparities in ADHD diagnosis. Add notes, references, or additional demographic data to the nodes to support your research findings.
Yes, you can open the .xmind file in Xmind and customize the nodes, add more branches (e.g., age groups), or change percentages to reflect your own data.
Absolutely. The clear two-branch structure makes it easy to present the gender gap in ADHD diagnosis rates. You can export it as an image or PDF for slides.
The template does not specify a source. You should verify the percentages against current research or replace them with data from your own studies.
把你的心智圖範本分享給全球創作者,從你的作品中獲得收益。
